SEO professionals know the drill: sifting through endless rows of keyword data, trying to find that golden nugget hidden in a sea of mediocrity. It’s tedious, time-consuming, and frankly, it’s not why you got into this business. Enter the Wild Iris SEO Tool—a new tool designed to assist and speed your keyword analysis process visually. With a few clicks, you can move from drowning in keywords data to pinpointing the opportunities that will drive your clients’ search engine success.
Imagine this: you’ve exported a hefty CSV from your go-to SEO tool. Hundreds, even thousands, of keywords stare back at you, each one begging for your attention. Which ones are worth the investment to write content for? Which ones will yield the highest ROI? In the past, answering those questions required manual sifting and selection. But now, thanks to the Wild Iris SEO Tool, those days are over.
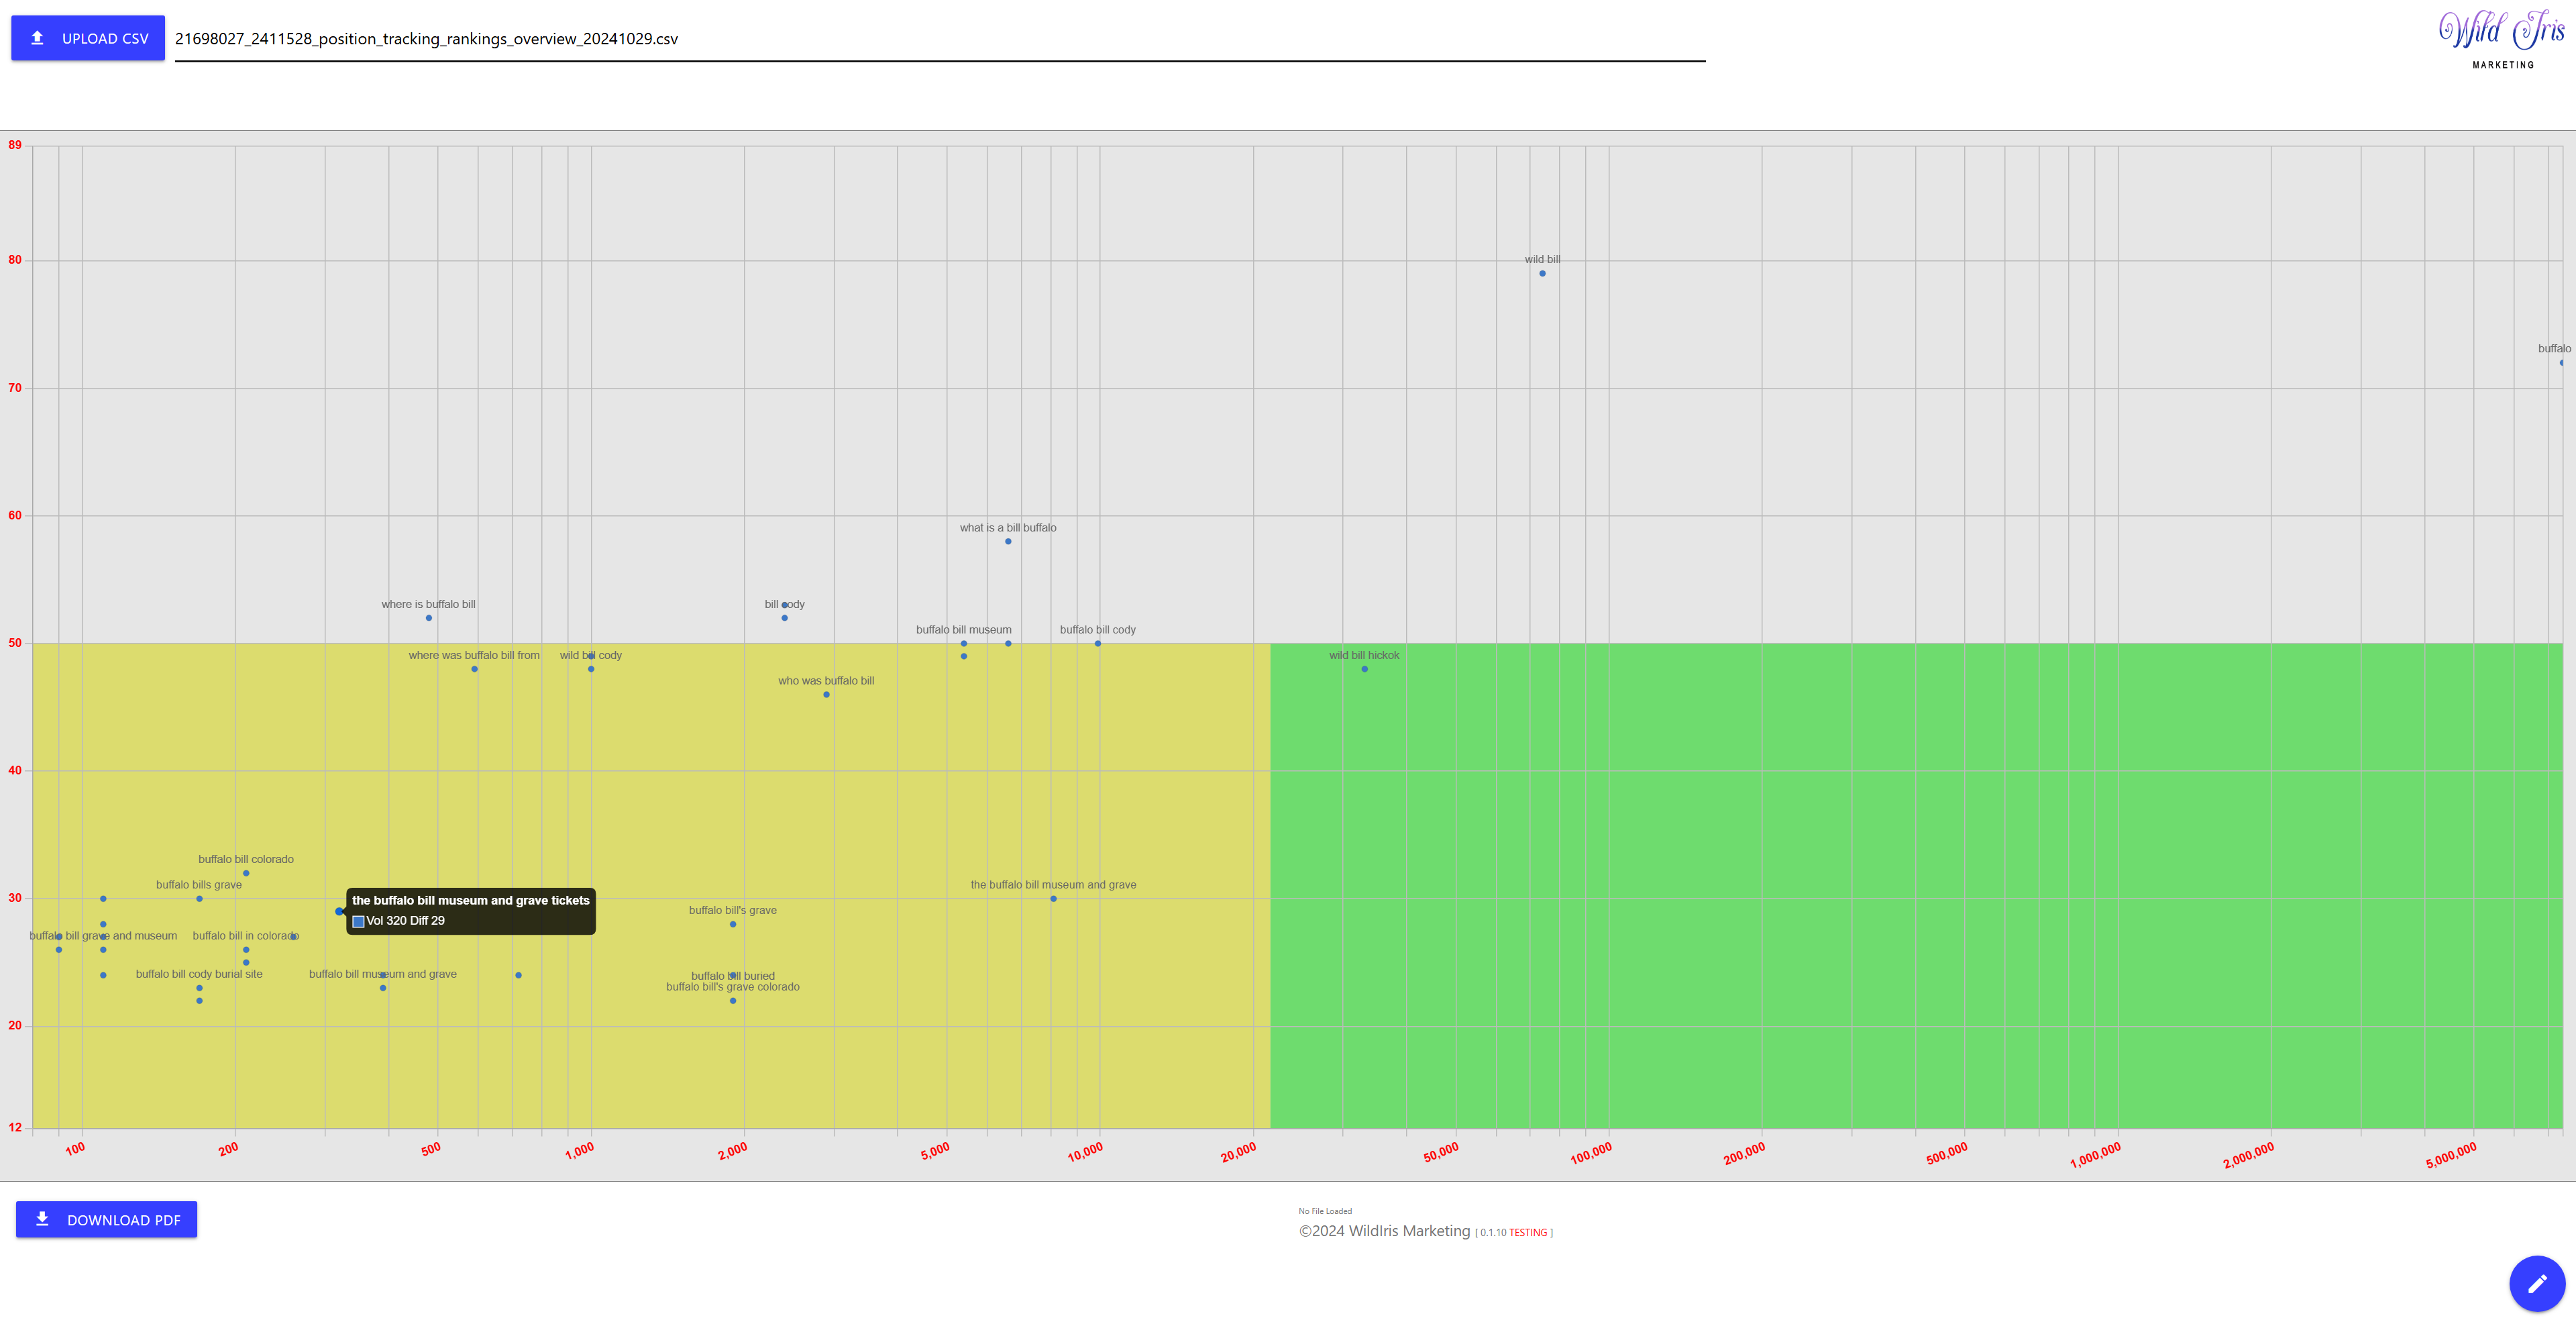
At its heart, the Wild Iris SEO Tool is a visualization tool. Using a 2D scatterplot, it places your keywords on an intuitive graph, plotting search volume against keyword difficulty. The X-axis scales logarithmically to accommodate the vast range of search volumes, while the Y-axis offers a linear perspective on difficulty. This elegant display turns your keyword data into a visual story, making it easy to identify the high-potential keywords that are both achievable and impactful.
The tool doesn’t just stop at pretty graphs. It’s built for interaction. You can very rapidly filter out irrelevant or misspelled keywords, hone in on the sweet spots, and seamlessly switch between a table view and the dynamic plot. Need to share your findings with a client or team? Download a high-quality PDF of the scatterplot or export a refined list of your best keywords to a new CSV.
But what truly sets this tool apart is its ability to save you time—lots of it. By turning raw data into actionable insights, the Wild Iris SEO Tool eliminates the grunt work, letting you focus on strategy and creativity. No more manual sorting. No more deleting rows manually in Excel or Google Sheets. Just clear, decisions powered by your own data, and in an intuitive visual form that is easy to communicate with your own clients. We designed this tool for ourselves, and it saves hours of our time, sifting the wheat from the chaff in keyword datasets.
Key Features:
CSV-Based Data Import: Compatible with exports from popular SEO tools such as SEMrush and Ahrefs, the tool requires only three columns: Keyword, Search Volume, and Keyword Difficulty.
Dot Plot Visualization: Displays keywords on a scatterplot with a logarithmic X-axis for search volume and a linear Y-axis for keyword difficulty, facilitating easy visualization of keyword opportunities.
Multiple Interaction Modes:
- Filter Mode: Allows users to exclude irrelevant or low-value keywords.
- Table View: Provides a sortable table format for detailed keyword review.
- Plot View: Offers a visual analysis of keyword potential.
Data Export Options: Enables downloading of filtered keyword lists or high-quality PDFs of the dot plot for reporting and presentations.
For SEO experts this tool isn’t just a convenience—it’s a competitive edge. Why are we giving it away? Honestly, we think it’s a pretty cool tool, and we want others to share in it and come up with ideas to make it better. Maybe it’ll be a paid tool someday, maybe not. But try it out and see for yourself if it’s helpful to you.
Read our page about the tool and get started. Right now all you need is a Google Account to authenticate with the tool, which keeps out some junk traffic. None of the data is sent to or stored on our servers (you can examine the code if you want to verify this!), so you can use it with sensitive data and know all the work is being done safely, solely in your browser.


