Websites with Maps and Data

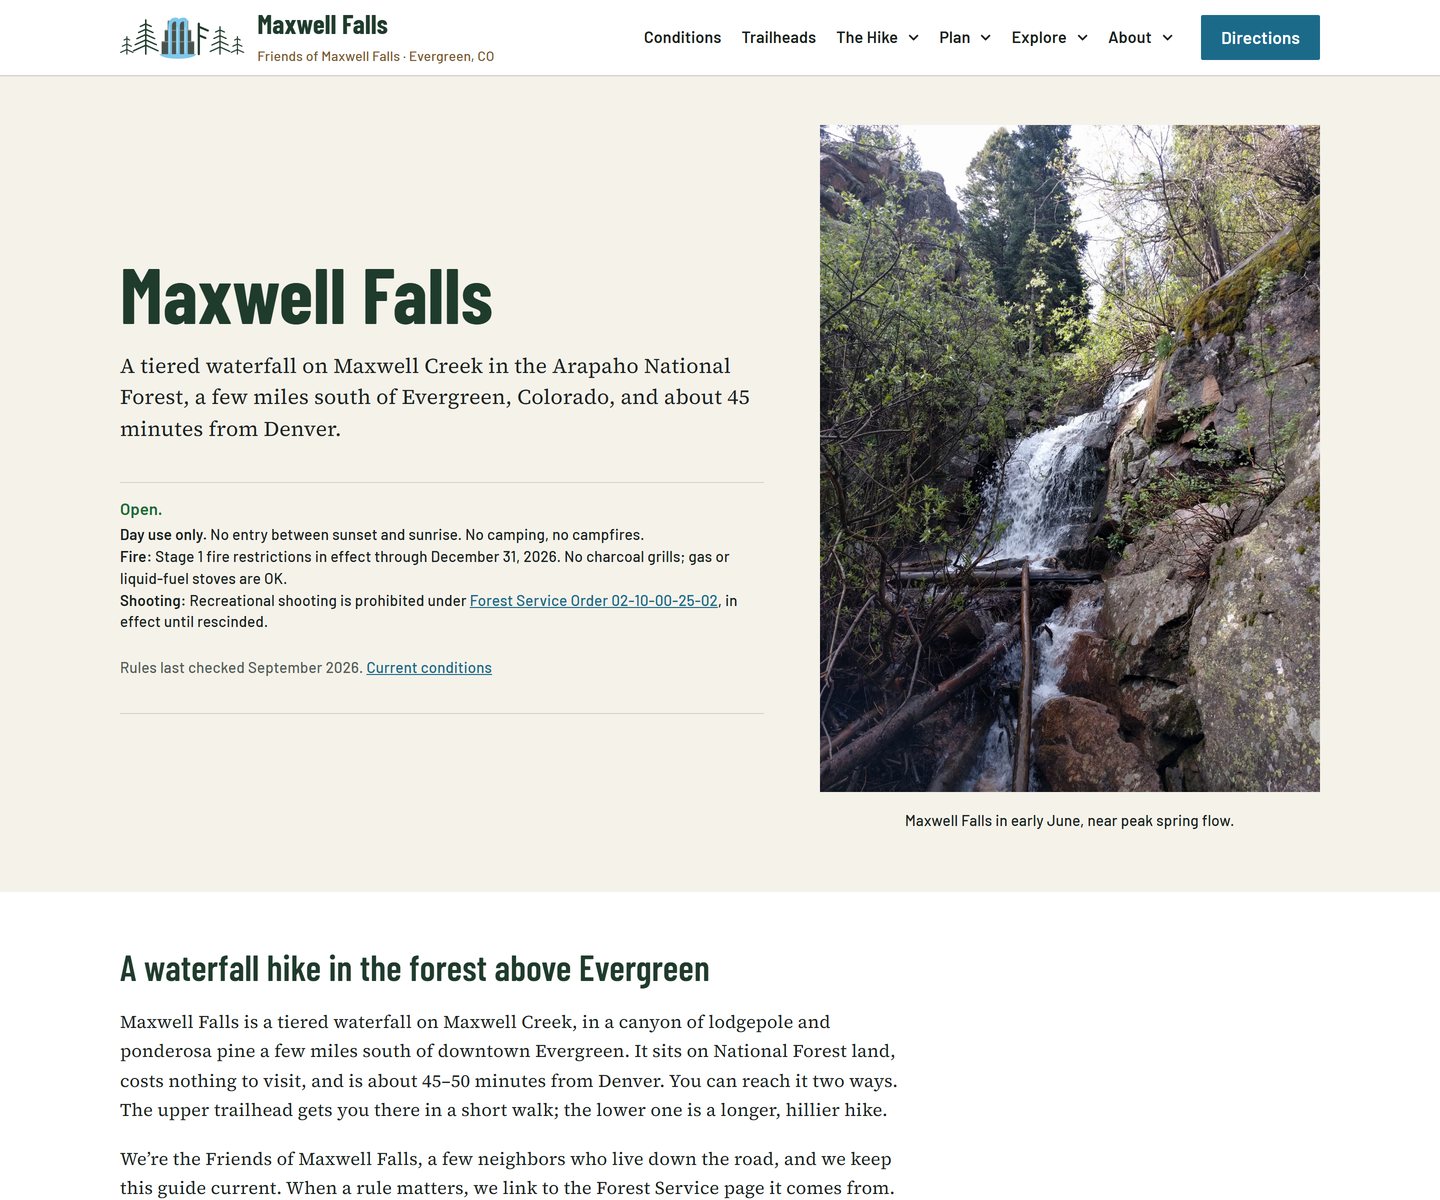
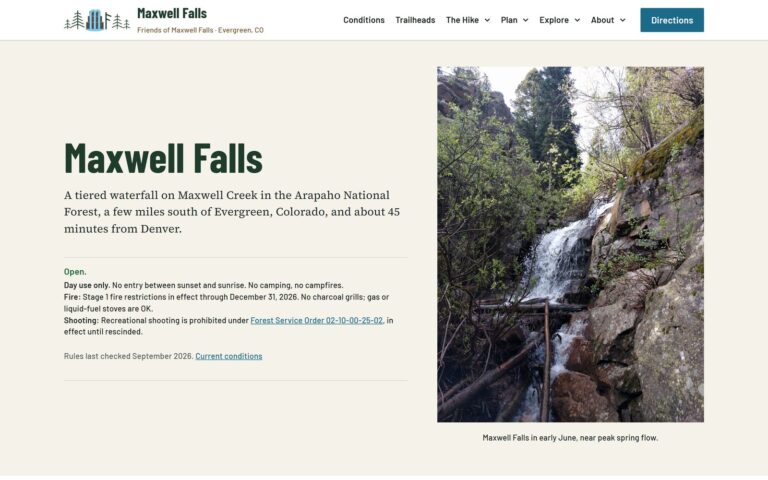
Home page of the Maxwell Falls trail guide at maxwellfalls.com

Someone standing at the Maxwell Falls lower trailhead, with one bar of signal, wants to know three things. Which way? How far? And is it okay to park here?

A well-thought-out and well-built website that answers those questions keeps everyone informed and not lost. We build mapping, GIS and complex websites for trail groups, research and policy organizations, and businesses whose customers need to find a place or understand data about places. We also manage Google Maps and Google Business Profiles for when you don’t need your own map, you just want to be ON the map.

When you need to find a map

Most websites have a map in the footer. Some websites are mostly map. A hiker asks, “Where do I park?” A resident asks, “Which neighborhoods are most at risk from extreme heat?” A customer asks, “Do you serve my area?” Often the answer is a place, and the website has to show the place clearly, on a mobile device, in the field, with trustworthy facts and data.

Our maps guide people to the right information:

  • Trail, park and open-space guides, and the community groups that keep them.
  • Research and policy sites that need to put a study in front of the public.
  • Local governments and districts with service areas, projects or closures to show.
  • Businesses whose customers need to find locations or check a service area.
A brass compass resting on an antique map of the world drawn as two hemispheres, in warm sepia tones
The original interactive map: you turned it. Updates shipped about once a generation, and it was no help at all finding the trailhead parking.

Two examples

Maxwell Falls trail guide

Maxwell Falls is just up the road from our Evergreen location. In 2017 we built maxwellfalls.com with AlphaPixel and Evergroove Studio, as Friends of Maxwell Falls, and in 2026 we rebuilt it from scratch.

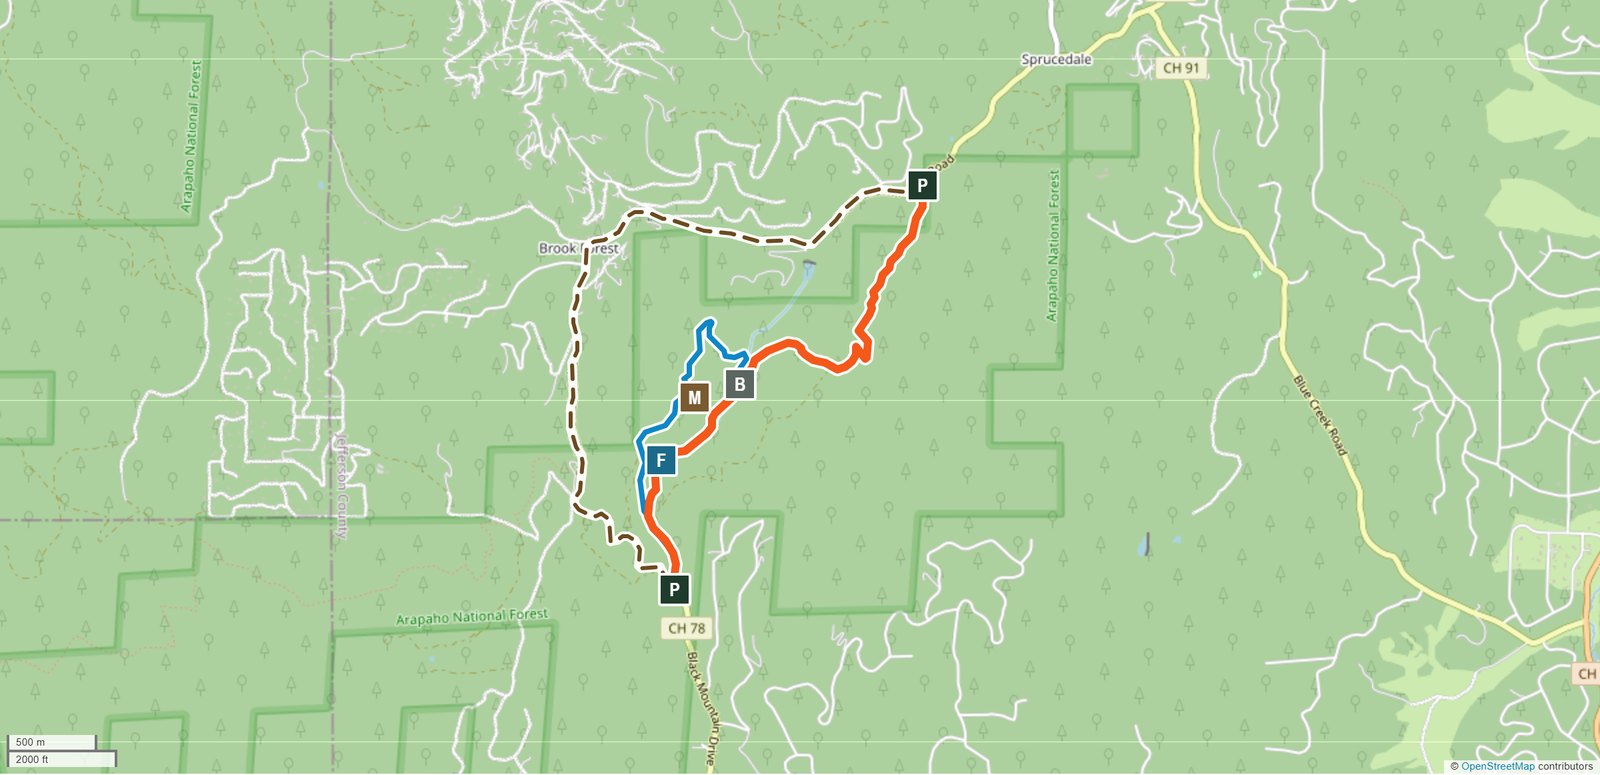
The new site covers three primary routes with a page comparing them, a trail map with downloadable GPS tracks, directions and parking for both trailheads, conditions, rules, safety and Leave No Trace. We checked details in person on site. Published distances for the hike don’t all agree, so AlphaPixel measured every route the same way, from OpenStreetMap trail lines and USGS lidar elevation data. Hikers can save the maps and GPS tracks to their phones before heading up, because the signal up there is spotty.

Wild Iris designed the site and hosts it. Anyone on our team can update a rule or the conditions note in a few minutes.

Read the story of the rebuild · Visit maxwellfalls.com

Trail map of the Maxwell Falls area: the hiking routes in orange and blue between the lower and upper trailheads, the falls, the footbridge and Meditation Rock, and the road between the two trailheads as a dashed line.
The trail map on maxwellfalls.com. AlphaPixel measured the routes and made the map. Map data © OpenStreetMap contributors.

Colorado Climate Change

The Colorado Fiscal Institute published research projecting what climate change could mean for Colorado by 2050: extreme heat, ozone pollution, wildfires and drought, under two emission scenarios. We built the website that puts that research in front of the public.

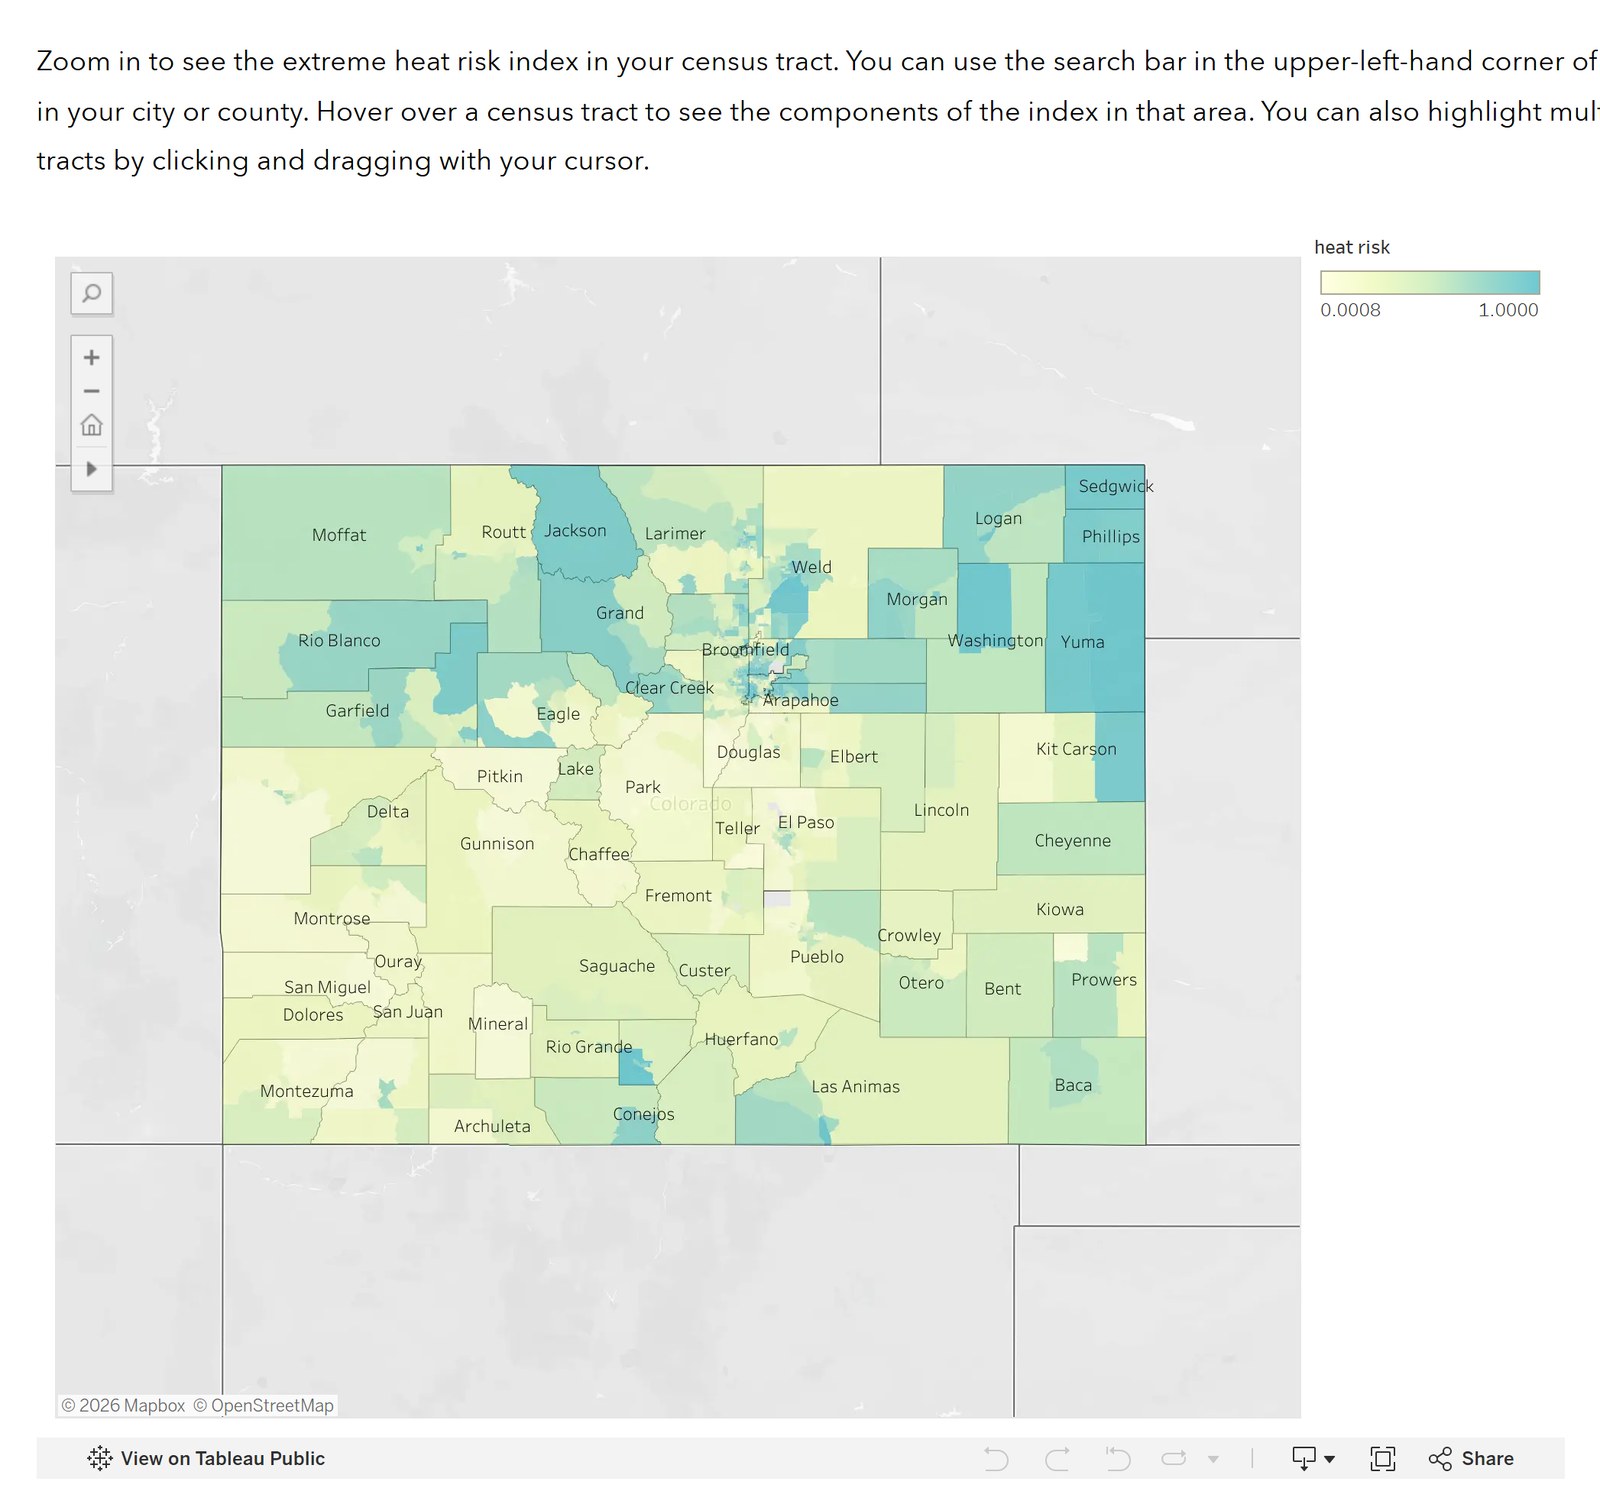
CFI made the maps in Tableau. We built the site around them: a page for each of the four impacts, with an emissions map and a risk map for each one, a page explaining how to read the maps, and the research paper and visual brief to download. Each risk map rates every census tract in Colorado from 0 to 1. Visitors can zoom in, search for their city or county, hover over a tract to see what goes into its score, and select several tracts to compare them.

We also produced the printed Colorado 2050 report that goes with the site.

Visit coloradoclimatechange.com

A map of Colorado divided into census tracts shaded from pale yellow to teal by extreme heat risk, with zoom and search controls, below the site’s instructions for using the map
The extreme heat risk map on coloradoclimatechange.com. The Colorado Fiscal Institute made the map in Tableau, and we built the website around it.

Who does what

Wild Iris Marketing builds and runs the website: the design, the writing, the page structure, accessibility, hosting and upkeep. We make sure the map sits inside a site people can actually use, with the answers written out around it.

AlphaPixel, our sister company, does the heavy GIS work: measuring routes, processing terrain and lidar data, serving map tiles and building custom map tools. AlphaPixel has been making maps for decades through its 3D Nature brand, from forest-harvest impact maps in the early 1990s to community fire situation maps during Colorado’s 2002 fire season. Its 2D and 3D maps have appeared in major national TV and print media.

You get one conversation and one team. If your project needs the deep technical end, we can put on our AlphaPixel hats and get to work.

What we look after for you

  • Maps that work on a phone, and without a signal. Downloadable GPS tracks and maps you can save before you go.
  • Data with dates and sources. Every rule on maxwellfalls.com links to the Forest Service page it comes from.
  • The answers written out, not only drawn. Directions, distances and findings in plain text, for screen readers and for anyone whose map won’t load.
  • Fast maps. Map tiles served from our own servers, with USGS imagery and OpenStreetMap data, or using a commercial map data service.
  • Pages your staff can update in the same editor as the rest of the site.
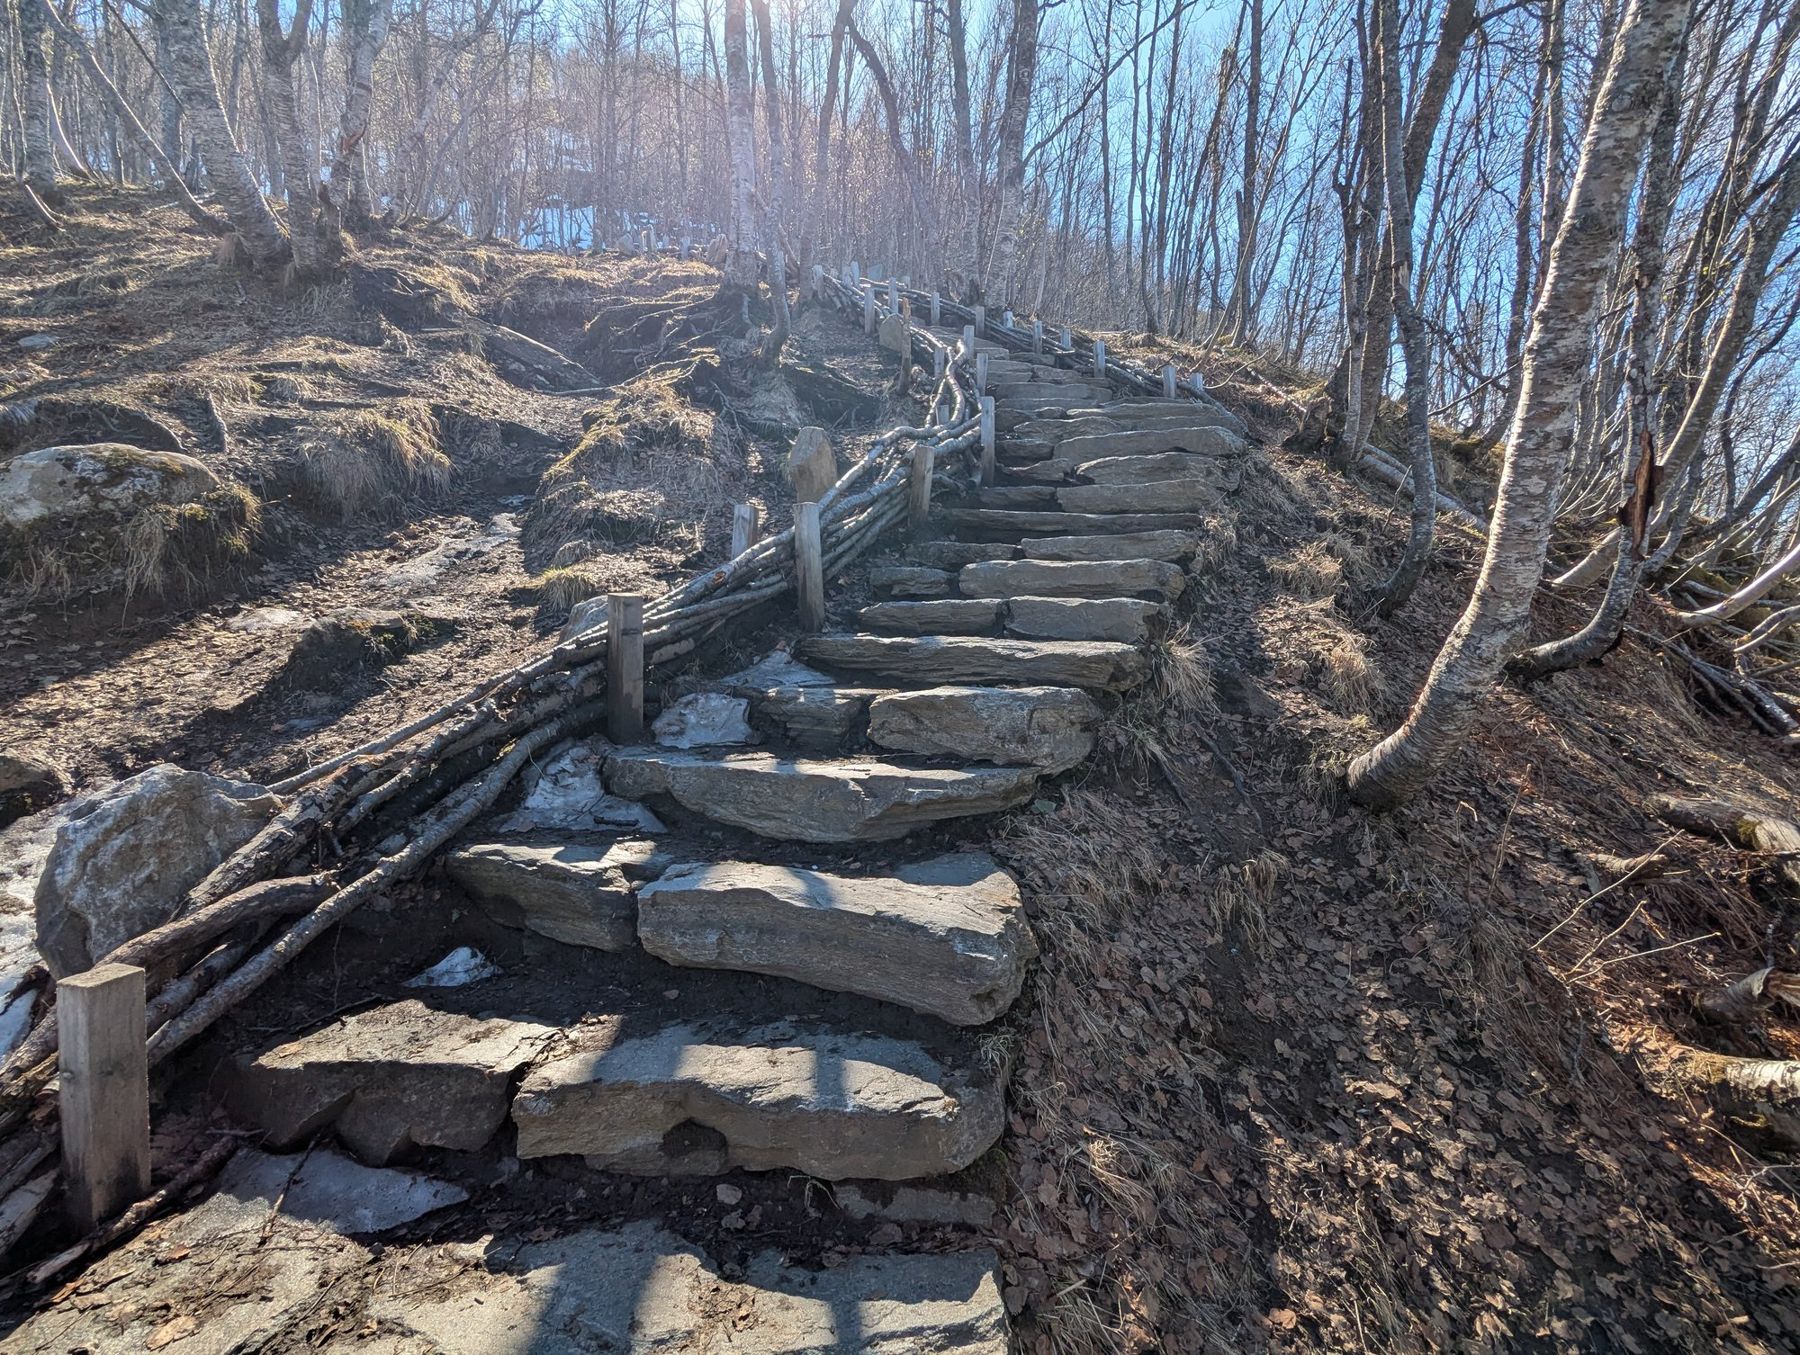
Rough stone steps climbing a hillside through bare birch trees, with a rustic wooden rail along one side, on a sunny spring day
Stone steps through the birch woods near Tromsø, Norway. We hiked this one, but we didn’t map it.

Questions people ask

Yes. That can be a simple embedded map of your service area, or a full set of custom maps with your own data. We’ll tell you which one your visitors actually need.

No. Your visitors only need a web browser. If your organization already makes maps in a tool like Tableau, any Esri product or virtually any modern map tool, we can build the website around them, the way we did for the Colorado Fiscal Institute.

Usually, yes. If your spreadsheet has addresses or coordinates, it can become a map. If not, we can help you geocode what you have. Bring what you have and we’ll look at it together.

A map is hard to use with a screen reader, so we never let the map be the only place the information lives. What the map shows is also written on the page: directions, distances, tables and plain-language findings. See our ADA compliance page for more.

You do. Your data and your content stay yours. Some background map data, such as OpenStreetMap, requires a credit line on the map, and we take care of that.

It depends on the data and how much of it there is. A service-area map is a small job. Measuring routes or mapping a research study is a bigger one. Call us, and the first consultation is free.

What our clients say.

Let's look at your map

Call us at 720-526-3636 or send a note through our contact form. Tell us what people need to find, or what your data shows. We’ll tell you what the website needs to do, and who on our team should do it.

Related reading

Skip to content